
Page 65 - PEN eBook July 2023
P. 65
Test & Measurement
SWITCHING-LOSS RESULTS
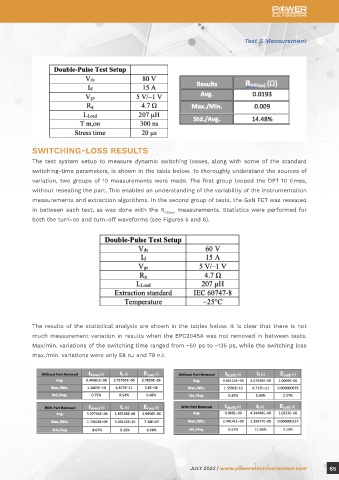
The test system setup to measure dynamic switching losses, along with some of the standard
switching-time parameters, is shown in the table below. To thoroughly understand the sources of
variation, two groups of 10 measurements were made. The first group looped the DPT 10 times,
without reseating the part. This enabled an understanding of the variability of the instrumentation
measurements and extraction algorithms. In the second group of tests, the GaN FET was reseated
in between each test, as was done with the R measurements. Statistics were performed for
DS(on)
both the turn-on and turn-off waveforms (see Figures 5 and 6).
The results of the statistical analysis are shown in the tables below. It is clear that there is not
much measurement variation in results when the EPC2045A was not removed in between tests.
Max/min. variations of the switching time ranged from ~50 ps to ~135 ps, while the switching loss
max./min. variations were only 58 nJ and 79 nJ.
JULY 2023 | www.powerelectronicsnews.com 65