
Page 66 - PEN eBook July 2023
P. 66
Test & Measurement
Figure 5: Example waveform of switching-loss Figure 6: Example waveform of switching-loss
measurements—turn-on measurements—turn-off
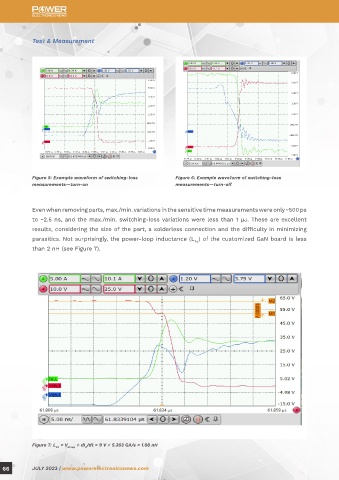
Even when removing parts, max./min. variations in the sensitive time measurements were only ~500 ps
to ~2.5 ns, and the max./min. switching-loss variations were less than 1 µJ. These are excellent
results, considering the size of the part, a solderless connection and the difficulty in minimizing
parasitics. Not surprisingly, the power-loop inductance (L ) of the customized GaN board is less
PL
than 2 nH (see Figure 7).
Figure 7: L = V droop ÷ dI /dt = 9 V ÷ 5.363 GA/s = 1.68 nH
d
PL
66 JULY 2023 | www.powerelectronicsnews.com