
Page 67 - PEN eBook July 2023
P. 67
Test & Measurement
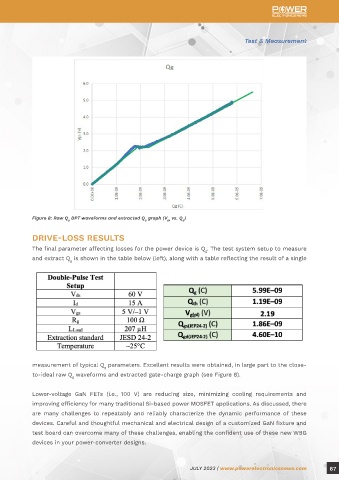
Figure 8: Raw Q DPT waveforms and extracted Q graph (V vs. Q )
g g gs g
DRIVE-LOSS RESULTS
The final parameter affecting losses for the power device is Q . The test system setup to measure
g
and extract Q is shown in the table below (left), along with a table reflecting the result of a single
g
measurement of typical Q parameters. Excellent results were obtained, in large part to the close-
g
to-ideal raw Q waveforms and extracted gate-charge graph (see Figure 8).
g
Lower-voltage GaN FETs (i.e., 100 V) are reducing size, minimizing cooling requirements and
improving efficiency for many traditional Si-based power MOSFET applications. As discussed, there
are many challenges to repeatably and reliably characterize the dynamic performance of these
devices. Careful and thoughtful mechanical and electrical design of a customized GaN fixture and
test board can overcome many of these challenges, enabling the confident use of these new WBG
devices in your power-converter designs.
JULY 2023 | www.powerelectronicsnews.com 67