
Page 16 - EE Times Europe Magazine - June 2025
P. 16
16 EE|Times EUROPE
Waymo’s Robotaxi Program: Progress and Potential
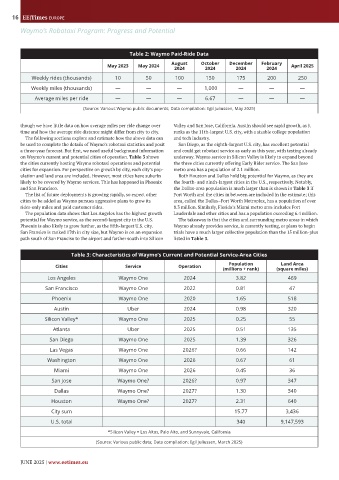
Table 2: Waymo Paid-Ride Data
August October December February
May 2023 May 2024 April 2025
2024 2024 2024 2024
Weekly rides (thousands) 10 50 100 150 175 200 250
Weekly miles (thousands) — — — 1,000 — — —
Average miles per ride — — — 6.67 — — —
(Source: Various Waymo public documents; Data compilation: Egil Juliussen, May 2025)
though we have little data on how average miles per ride change over Valley and San Jose, California. Austin should see rapid growth, as it
time and how the average ride distance might differ from city to city. ranks as the 11th-largest U.S. city, with a sizable college population
The following sections explore and estimate how the above data can and tech industry.
be used to complete the details of Waymo’s robotaxi statistics and posit San Diego, as the eighth-largest U.S. city, has excellent potential
a three-year forecast. But first, we need useful background information and could get robotaxi service as early as this year, with testing already
on Waymo’s current and potential cities of operation. Table 3 shows underway. Waymo service in Silicon Valley is likely to expand beyond
the cities currently hosting Waymo robotaxi operations and potential the three cities currently offering Early Rider service. The San Jose
cities for expansion. For perspective on growth by city, each city’s pop- metro area has a population of 2.1 million.
ulation and land area are included. However, most cities have suburbs Both Houston and Dallas hold big potential for Waymo, as they are
likely to be covered by Waymo services. This has happened in Phoenix the fourth- and ninth-largest cities in the U.S., respectively. Notably,
and San Francisco. the Dallas-area population is much larger than is shown in Table 3 if
The list of future deployments is growing rapidly, so expect other Fort Worth and the cities in between are included in the estimate; this
cities to be added as Waymo pursues aggressive plans to grow its area, called the Dallas–Fort Worth Metroplex, has a population of over
rider-only miles and paid customer rides. 8.3 million. Similarly, Florida’s Miami metro area includes Fort
The population data shows that Los Angeles has the highest growth Lauderdale and other cities and has a population exceeding 6.4 million.
potential for Waymo service, as the second-largest city in the U.S. The takeaway is that the cities and surrounding metro areas in which
Phoenix is also likely to grow further, as the fifth-largest U.S. city. Waymo already provides service, is currently testing, or plans to begin
San Fransico is ranked 17th in city size, but Waymo is on an expansion trials have a much larger collective population than the 15 million-plus
path south of San Franciso to the airport and farther south into Silicon listed in Table 3.
Table 3: Characteristics of Waymo’s Current and Potential Service-Area Cities
Land Area
Population
Cities Service Operation (millions + rank) (square miles)
Los Angeles Waymo One 2024 3.82 469
San Francisco Waymo One 2022 0.81 47
Phoenix Waymo One 2020 1.65 518
Austin Uber 2024 0.98 320
Silicon Valley* Waymo One 2025 0.25 55
Atlanta Uber 2025 0.51 135
San Diego Waymo One 2025 1.39 326
Las Vegas Waymo One 2026? 0.66 142
Washington Waymo One 2026 0.67 61
Miami Waymo One 2026 0.45 36
San Jose Waymo One? 2026? 0.97 347
Dallas Waymo One? 2027? 1.30 340
Houston Waymo One? 2027? 2.31 640
City sum 15.77 3,436
U.S. total 340 9,147,593
*Silicon Valley = Los Altos, Palo Alto, and Sunnyvale, California
(Source: Various public data; Data compilation: Egil Juliussen, March 2025)
JUNE 2025 | www.eetimes.eu