
Page 18 - EE Times Europe Magazine - June 2025
P. 18
18 EE|Times EUROPE
Waymo’s Robotaxi Program: Progress and Potential
Total cumulative rider-only miles grew from 1 million at year-end to more than 48 million in 2027.
2022 to 9.3 million in 2023 and more than 50 million miles at year-end The typical price per ride ranges from $15 to more than $30 and
2024. Cumulative miles are projected to triple this year, to 154 million, varies by city, trip length, and time of day. Internet research showed
and top 632 million at year-end 2027. that Phoenix has the lowest average prices and Los Angeles has the
highest. Phoenix also has the lowest price per mile and Los Angeles
WAYMO REVENUE FORECAST SCENARIO has the highest price per mile. Finally, Phoenix has the highest average
To estimate the revenue by city, the yearly trip estimates for each city trip length because it has the largest coverage area and airport access,
are needed. Waymo’s data on weekly trips was listed in Table 2. Data while San Francisco has the shortest average trip length.
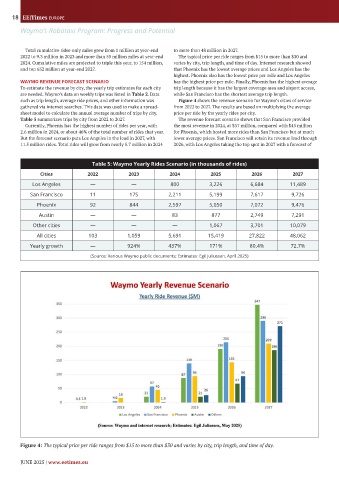
such as trip length, average ride prices, and other information was Figure 4 shows the revenue scenario for Waymo’s cities of service
gathered via internet searches. This data was used to make a spread- from 2022 to 2027. The results are based on multiplying the average
sheet model to calculate the annual average number of trips by city. price per ride by the yearly rides per city.
Table 5 summarizes trips by city from 2022 to 2027. The revenue forecast scenario shows that San Francisco provided
Currently, Phoenix has the highest number of rides per year, with the most revenue in 2024, at $57 million, compared with $45 million
2.6 million in 2024, or about 46% of the total number of rides that year. for Phoenix, which hosted more rides than San Francisco but at much
But the forecast scenario puts Los Angeles in the lead in 2027, with lower average prices. San Francisco will retain its revenue lead through
11.5 million rides. Total rides will grow from nearly 5.7 million in 2024 2026, with Los Angeles taking the top spot in 2027 with a forecast of
Table 5: Waymo Yearly Rides Scenario (in thousands of rides)
Cities 2022 2023 2024 2025 2026 2027
Los Angeles — — 800 3,226 6,684 11,489
San Francisco 11 175 2,211 5,199 7,617 9,726
Phoenix 92 844 2,597 5,050 7,072 9,476
Austin — — 83 877 2,749 7,291
Other cities — — — 1,067 3,701 10,079
All cities 103 1,059 5,691 15,419 27,822 48,062
Yearly growth — 924% 437% 171% 80.4% 72.7%
(Source: Various Waymo public documents; Estimates: Egil Juliussen, April 2025)
Figure 4: The typical price per ride ranges from $15 to more than $30 and varies by city, trip length, and time of day.
JUNE 2025 | www.eetimes.eu