
Page 33 - 23_EETE_03
P. 33
EE|Times EUROPE 33
Green Electricity Key to Eliminating Transportation CO 2
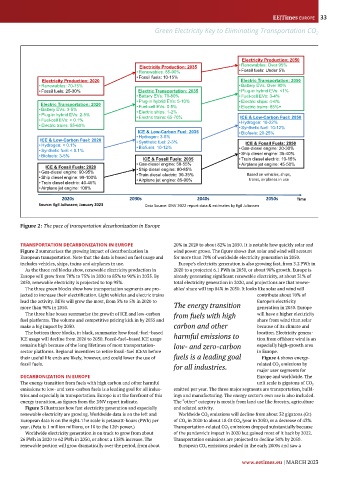
Electricity Production: 2050
Electricity Production: 2035 • Renewables: Over 95%
• Renewables: 85-90% • Fossil fuels: Under 5%
• Fossil fuels: 10-15%
Electricity Production: 2020 Electric Transportation: 2050
• Renewables: 70-75% • Battery EVs: Over 90%
• Fossil fuels: 25-30% Electric Transportation: 2035 • Plug-in hybrid EVs: <1%
• Battery EVs: 70-80% • Fuel-cell EVs: 3-4%
• Plug-in hybrid EVs: 5-10% • Electric ships: 4-6%
Electric Transportation: 2020 • Fuel-cell EVs: 0.5% • Electric trains: 85%+
• Battery EVs: 3-5% • Electric ships: 1-2%
• Plug-in hybrid EVs: 2-5% • Electric trains: 65-70% ICE & Low-Carbon Fuel: 2050
• Fuel-cell EVs: < 0.1% • Hydrogen: 18-22%
• Electric trains: 55-60% • Synthetic fuel: 10-12%
ICE & Low-Carbon Fuel: 2035 • Biofuels: 20-25%
• Hydrogen: 3-5%
ICE & Low-Carbon Fuel: 2020 • Synthetic fuel: 2-3%
• Hydrogen: < 0.1% • Biofuels: 10-12% ICE & Fossil Fuels: 2050
• Synthetic fuel: < 0.1% • Gas-diesel engine: 20-30%
• Biofuels: 3-5% • Ship diesel engine: 35-40%
ICE & Fossil Fuels: 2035 • Train diesel electric: 10-15%
• Gas-diesel engine: 50-55% • Airplane jet engine: 45-50%
ICE & Fossil Fuels: 2020
• Gas-diesel engine: 90-95% • Ship diesel engine: 80-85% Based on vehicles, ships,
• Train diesel electric: 30-35%
• Ship diesel engine: 99-100% • Airplane jet engine: 85-90% trains, airplanes in use
• Train diesel electric: 40-45%
• Airplane jet engine: 100%
2020s 2030s 2040s 2050s Time
Source: Egil Juliussen; January 2023 Data Source: DNV 2022 report data & estimates by Egil Juliussen
Figure 2: The pace of transportation decarbonization in Europe
TRANSPORTATION DECARBONIZATION IN EUROPE 20% in 2020 to about 82% in 2050. It is notable how quickly solar and
Figure 2 summarizes the growing impact of decarbonization in wind power grows. The figure shows that solar and wind will account
European transportation. Note that the data is based on fuel usage and for more than 70% of worldwide electricity generation in 2050.
includes vehicles, ships, trains and airplanes in use. Europe’s electricity generation is also growing fast, from 3.2 PWh in
As the three red blocks show, renewable electricity production in 2020 to a projected 6.1 PWh in 2050, or about 90% growth. Europe is
Europe will grow from 70% to 75% in 2020 to 85% to 90% in 2035. By already generating significant renewable electricity, at about 31% of
2050, renewable electricity is projected to top 95%. total electricity generation in 2020, and projections are that renew-
The three green blocks show how transportation segments are pro- ables’ share will top 84% in 2050. It looks like solar and wind will
jected to increase their electrification. Light vehicles and electric trains contribute about 70% of
lead the activity. BEVs will grow the most, from 3% to 5% in 2020 to Europe’s electricity
more than 90% in 2050. The energy transition generation in 2050. Europe
The three blue boxes summarize the growth of ICE and low-carbon from fuels with high will have a higher electricity
fuel platforms. The volume and competitive pricing kick in by 2035 and share from wind than solar
make a big impact by 2050. carbon and other because of its climate and
The bottom three blocks, in black, summarize how fossil-fuel–based harmful emissions to location. Electricity genera-
ICE usage will decline from 2020 to 2050. Fossil-fuel–based ICE usage tion from offshore wind is an
remains high because of the long lifetimes of most transportation- low- and zero-carbon especially high-growth area
sector platforms. Regional incentives to retire fossil-fuel ICEVs before in Europe.
their useful life ends are likely, however, and could lower the use of fuels is a leading goal Figure 4 shows energy-
fossil fuels. related CO 2 emissions by
for all industries. major user segments for
DECARBONIZATION IN EUROPE Europe and worldwide. The
The energy transition from fuels with high carbon and other harmful unit scale is gigatons of CO 2
emissions to low- and zero-carbon fuels is a leading goal for all indus- emitted per year. The three major segments are transportation, build-
tries and especially in transportation. Europe is at the forefront of this ings and manufacturing. The energy sector’s own use is also included.
energy transition, as figures from the DNV report indicate. The “other” category is mostly from land use like forestry, agriculture
Figure 3 illustrates how fast electricity generation and especially and related activity.
renewable electricity are growing. Worldwide data is on the left and Worldwide CO 2 emissions will decline from about 32 gigatons (Gt)
European data is on the right. The scale is petawatt-hours (PWh) per of CO 2 in 2020 to about 18 Gt CO 2 /year in 2050, or a decrease of 43%.
year. (Peta is 1 million millions, or 10 to the 12th power.) Transportation-related CO 2 emissions dropped substantially because
Worldwide electricity generation is on track to grow from about of the pandemic’s impact in 2020 but gained most of it back by 2022.
26 PWh in 2020 to 62 PWh in 2050, or about a 138% increase. The Transportation emissions are projected to decline 30% by 2050.
renewable portion will grow dramatically over the period, from about European CO 2 emissions peaked in the early 2000s and saw a
www.eetimes.eu | MARCH 2023