
Page 13 - EETEurope FlipBook February
P. 13
EE|Times EUROPE 13
Performance-Regression Pitfalls Every Project Should Avoid
We devised a solution by creating an extension to the open-source not account for the incremental performance improvements over the
Phoronix Test Suite called Phoronix Test Extensions. These are clearly year of development.
enumerated and identified Phoronix-compatible tests that never Manually adjusting performance baseline criteria would be costly
change, can easily be communicated, can be stored in a database, and and error-prone. Our in-house system automatically adjusts baselines
present output in a standardized format for easy and uniform process- based on every result collected. The more test results it collects, the
ing. This type of approach streamlines the process and dramatically smarter the system becomes.
improves the quality and reliability of results.
For example, the above FIO command line might be packaged in Remember, the test process can affect system performance.
a Phoronix-compatible test, called ptx-io-fio-randread-4k-libaio- It’s an unfortunate reality of performance testing that the measure-
iod256-000001, that gets codified in a source code repository from ment process itself can affect the results. Capturing system data such
which it can be referenced and run. Because the test is fully compat- as clock frequencies, active processes, and CPU utilization can eat up
ible with the Phoronix test runner, it can be run anywhere Phoronix system resources, reducing workload performance in some (but not all)
runs, making it extremely portable and flexible. It also outputs a configurations. For the unwary, this can lead to time wasted chasing
standard composite.xml results format, as defined in the Phoronix phantom regressions.
test runner — making the results of any test in the library uniform The solution is to abstract the hardware monitoring process from the
and parsable. performance measurement process. For example, you could do four test
runs for each configuration. Use the first three datasets in the
performance-regression analysis. The
fourth run would measure hardware
behavior. The results of the fourth run
would be used strictly to provide system
measurement information and would not
be used in the regression analysis.
Develop effective, standardized
reporting.
The best test infrastructure is useless if the
results are not presented in an actionable
way. Poor data science practices can easily
misrepresent performance or obscure
patterns. Data plots with inconsistent
and non-zero scales can prevent easy
comparison. Showing single run changes
without also showing variance can also be
problematic or misleading. Some tests are
hyper-consistent — a delta of 1% is huge.
For others, ±2% would be a normal intra-
run deviation. Data presentation must make
those differences easy to detect in context.
The sheer volume of data produced by
continuous performance-regression test-
ing demands an easy format for visualizing
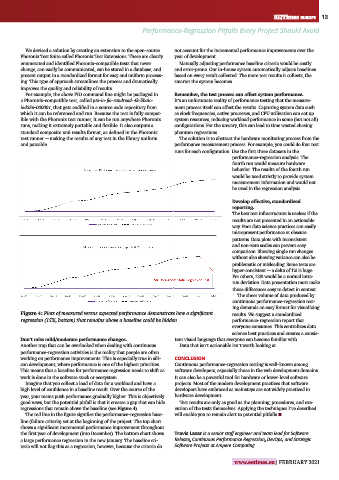
Figure 4: Plots of measured versus expected performance demonstrate how a significant results. We suggest a standardized
regression (15%, bottom) that remains above a baseline could be hidden. performance-regression report that
everyone consumes. This centralizes data
science best practices and creates a consis-
Don’t miss mild/moderate performance changes. tent visual language that everyone can become familiar with.
Another trap that can be overlooked when dealing with continuous Data that isn’t actionable isn’t worth looking at.
performance-regression activities is the reality that people are often
working on performance improvements. This is especially true in sili- CONCLUSION
con development, where performance is one of the highest priorities. Continuous performance-regression testing is well-known among
This means that a baseline for performance regression needs to shift as software developers, especially those in the web development domains.
work is done in the software stack or ecosystem. It can also be a powerful tool for hardware or lower-level software
Imagine that you collect a load of data for a workload and have a projects. Most of the modern development practices that software
high level of confidence in a baseline result. Over the course of the developers have embraced as mainstays are not widely practiced in
year, your teams push performance gradually higher. This is objectively hardware development.
good news, but the potential pitfall is that it creates a gap that can hide Test results are only as good as the planning, procedures, and exe-
regressions that remain above the baseline (see Figure 4). cution of the tests themselves. Applying the techniques I’ve described
The red line in the figure signifies the performance-regression base- will enable you to remain alert to potential pitfalls. ■
line (failure criteria) set at the beginning of the project. The top chart
shows a significant incremental performance improvement throughout
the first year of development (into December). The bottom chart shows Travis Lazar is a senior staff engineer and team lead for Software
a large performance regression in the new January. The baseline cri- Release, Continuous Performance Regression, DevOps, and Strategic
teria will not flag this as a regression, however, because the criteria do Software Projects at Ampere Computing.
www.eetimes.eu | FEBRUARY 2021