
Page 8 - PEN eBook May 2022
P. 8
Cover Story – Design Cover Story – Design
the traction battery, thereby reducing charging time.
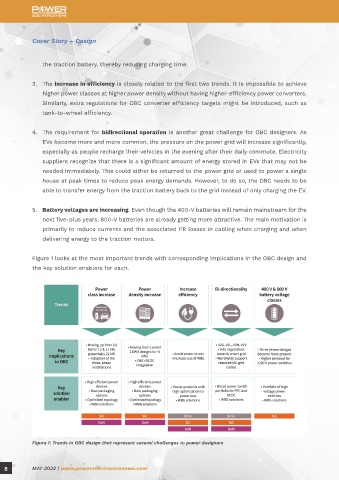
3. The increase in efficiency is closely related to the first two trends. It is impossible to achieve
higher power classes at higher power density without having higher-efficiency power converters.
Similarly, extra regulations for OBC converter efficiency targets might be introduced, such as
tank-to-wheel efficiency.
4. The requirement for bidirectional operation is another great challenge for OBC designers. As
EVs become more and more common, the pressure on the power grid will increase significantly,
especially as people recharge their vehicles in the evening after their daily commute. Electricity
suppliers recognize that there is a significant amount of energy stored in EVs that may not be
needed immediately. This could either be returned to the power grid or used to power a single
house at peak times to reduce peak energy demands. However, to do so, the OBC needs to be Figure 2: FoM comparison among the different technologies offered by Infineon
able to transfer energy from the traction battery back to the grid instead of only charging the EV.
The topology chosen will be essential to address these challenges, as will be the technology used —
5. Battery voltages are increasing. Even though the 400-V batteries will remain mainstream for the especially for the switching components. In most cases, WBG solutions can contribute significantly
next five-plus years, 800-V batteries are already getting more attractive. The main motivation is to providing the performance benefits needed.
primarily to reduce currents and the associated I R losses in cabling when charging and when
2
delivering energy to the traction motors. FIGURES OF MERIT AND TECHNICAL DIFFERENCES AMONG Si,
SiC, AND GaN
Figure 1 looks at the most important trends with corresponding implications in the OBC design and The first step when analyzing which WBG device is suitable for OBC applications would be to
the key solution enablers for each. compare the different FoMs of each technology. These are summarized in Figure 2.
Each of these FoMs has a distinct meaning and quantifies the implications that exist in the
different topologies. It is worth mentioning that the lower the value of the FoM, including the R
DS(on)
temperature coefficient, the better the positioning of that technology in the application. The proper
selection of the technology is not made by choosing only one FoM but a combination of them.
For example, the combination of R × Q + R × E + R temperature coefficient indicates
DS(on) rr DS(on) oss DS(on)
that either SiC or GaN is the best candidate for a hard-switching application, such as continuous-
conduction–mode totem-pole power-factor correction (PFC), and has the best price-performance
ratio. On the other hand, the combination of R × Q + R × Q + V + R temperature
DS(on) oss DS(on) g F DS(on)
coefficient indicates that GaN is the most suitable technology to be used in soft-switching
applications, working at very high switching frequencies (>400 kHz). As a result, a system-level cost
reduction is achieved by reducing the size of the magnetics and other passives as well as reducing
the cooling efforts for a very high-power–density design at an efficiency level that would be difficult
for silicon-based solutions to match.
Figure 1: Trends in OBC design that represent several challenges to power designers
8 MAY 2022 | www.powerelectronicsnews.com MAY 2022 | www.powerelectronicsnews.com 9